Bacteria Sampling 2022
Program finds Creeks Heavily Polluted with Fecal Bacteria

The final report from our 2022 16 week bacteria monitoring program shows that the Willett Branch and the Little Falls Branch do not meet the recommended Maryland State standards for safe water play because of their consistently high e. coli levels. Our citizen scientists tested the Willett Branch in three locations in Chevy Chase. These locations were the most heavily impaired with e. coli counts regularly exceeding the capability of the lab to count the organisms. The Little Falls Branch saw lower numbers, but all sites failed at some point in the summer and two sites never dipped down to 410, the “passing” level. Only one site, the Little Falls Branch where it passes through Somerset, was met the Geometric means standards for safe water play. Scroll down to see trend charts from the summer program.
Both Creeks are slightly acidic with pH values below 7. The Willett Branch’s average pH is 6.04 which below the 6.5 level which is considered at the low range for tolerance by aquatic life (6.5 - 8.5).
Information on dissolved oxygen and seasonal air and water temperate are also presented in the report. Dissolved oxygen is important in that it allows aquatic life to breathe. We test the Little Falls Branch monthly at LFB2. While there were some months with low levels, in general there is no problem with dissolved oxygen in the Little Falls Branch.
Temperature is a critical water quality and environmental parameter because it governs the kinds and types of aquatic life, regulates the maximum dissolved oxygen concentration of the water, and influences the rate of chemical and biological reactions. We take the temperature of the Little Falls Branch in one location once a month. It is in a safe range.
READ the Complete Report Here.
UPDATES

2022 Testing Locations
Pass/Fail Criteria
E. coli levels up to 410 are considered passing based on Maryland and the District of Columbia's water quality single-sample standards for E. coli in surface waters.
The amount of E. coli is reported as Most Probable Number (MPN) per 100 milliliters (ml). Whereas counts up to 410 are considered passing, the following are benchmarks used throughout the Potomac River watershed for reporting E. coli levels in streams:
HIGH – greater than 410 MPN/100 ml.
MODERATE – 126 to 410 MPN/100 ml
LOW – 125 MPN/100 ml or less
Our lab work is done by the Anacostia Riverkeeper’s water quality lab.
2,419.6 - This number is the highest count that the standard test computes. A greater than symbol (>) indicates that the actual number is greater than 2,419 but the test is not able to count these higher numbers. We use a 10% dilution test on the Willet Branch A samples as this site frequently registers numbers well above 2,419.6.
Any question about our testing methods can be directed to us at Bacteria@LFWA.org.
LFWA Monitoring program

By testing for bacteria, we hope to inform residents of the safety of the water for splashing and wading as well as determine if there is a need for sewer line repairs in the watershed. Volunteers also test the pH and measure air and water temperature. The samples are analyzed at a water quality lab run by Anacostia Riverkeeper. Results are posted on our Facebook page, on kiosks close to the creek, on community listservs, on TheSwimGuide.org, and on our website.
2022 Locations (as shown on the map)
Willett Branch at the end of Willett Parkway where path curves to Norwood Park – WB1
Willett Branch at the end of Willett Parkway where path curves to Norwood Park – WB2
Willett Branch at the end of Willett Parkway where path curves to Norwood Park – WB A
Little Falls Branch upstream from the Somerset pool – LFB1
Little Falls Branch downstream from Mass. Ave. bridge at the second bench – LFB2
Little Falls Branch downstream from Mass. Ave. bridge at the first pedestrian bridge – LFB3 (coming July 17)
Little Falls Branch on Potomac River side of MacArthur Blvd in Brookmont – LFB4
2022 Testing dates - every Wednesday, June 1 to September 14
what is fecal bacteria?
Fecal coliform bacteria are found in the feces of warm-blooded animals such as people, pets, and wildlife. Fecal coliform contamination in streams can come from leaking sewer pipes and many small sources such as pet waste in stormwater runoff. Wildlife and birds also contribute. As the amount of fecal coliform bacteria in the water increases, the risk of contracting a waterborne illness increases.

Fecal bacteria Health risks
The best indicator of the health risk from recreational water contact is E. coli, which is a species of fecal coliform bacteria that is specific to fecal material from humans and other warm-blooded animals. The presence of E. coli is also used as an indicator to monitor the possible presence of other more harmful microbes, such as Cryptosporidium, Giardia, Shigella, and norovirus. Some of the symptoms of illness associated with fecal coliform bacteria contamination are upset stomach, diarrhea, ear infections, and rashes. However, some bacteria, such as some strands of E coli, hepatitis, and Salmonella, can have very severe health effects.
Fecal Coliform Creates Problems for fish and Aquatic Plants
High levels of fecal coliform can cause other problems as well. Sewage and other contaminants contain nitrogen and phosphorus, which act as fertilizer for algae and other aquatic plants. An overgrowth of plants can deplete dissolved oxygen needed by fish and other aquatic animals. affect the natural acidic-alkaline (pH) balance of water, create odor problems, and affect property values.
The possibility of bacterial contamination increases in the summer months, which is also the time when more people come in contact with the streams in the watershed.
2022 Trend Charts
🟩 Pass: E. coli between 0-410 per 100mL 🟥 Fail: E. coli above 410 per 100mL
Geometric mean represents the average bacteria level of all the dates listed
Historical Data
2022 Results
Summer 2022 results from 7 sites along the Little Falls and Willett Branches. Complete data with rainfall levels.
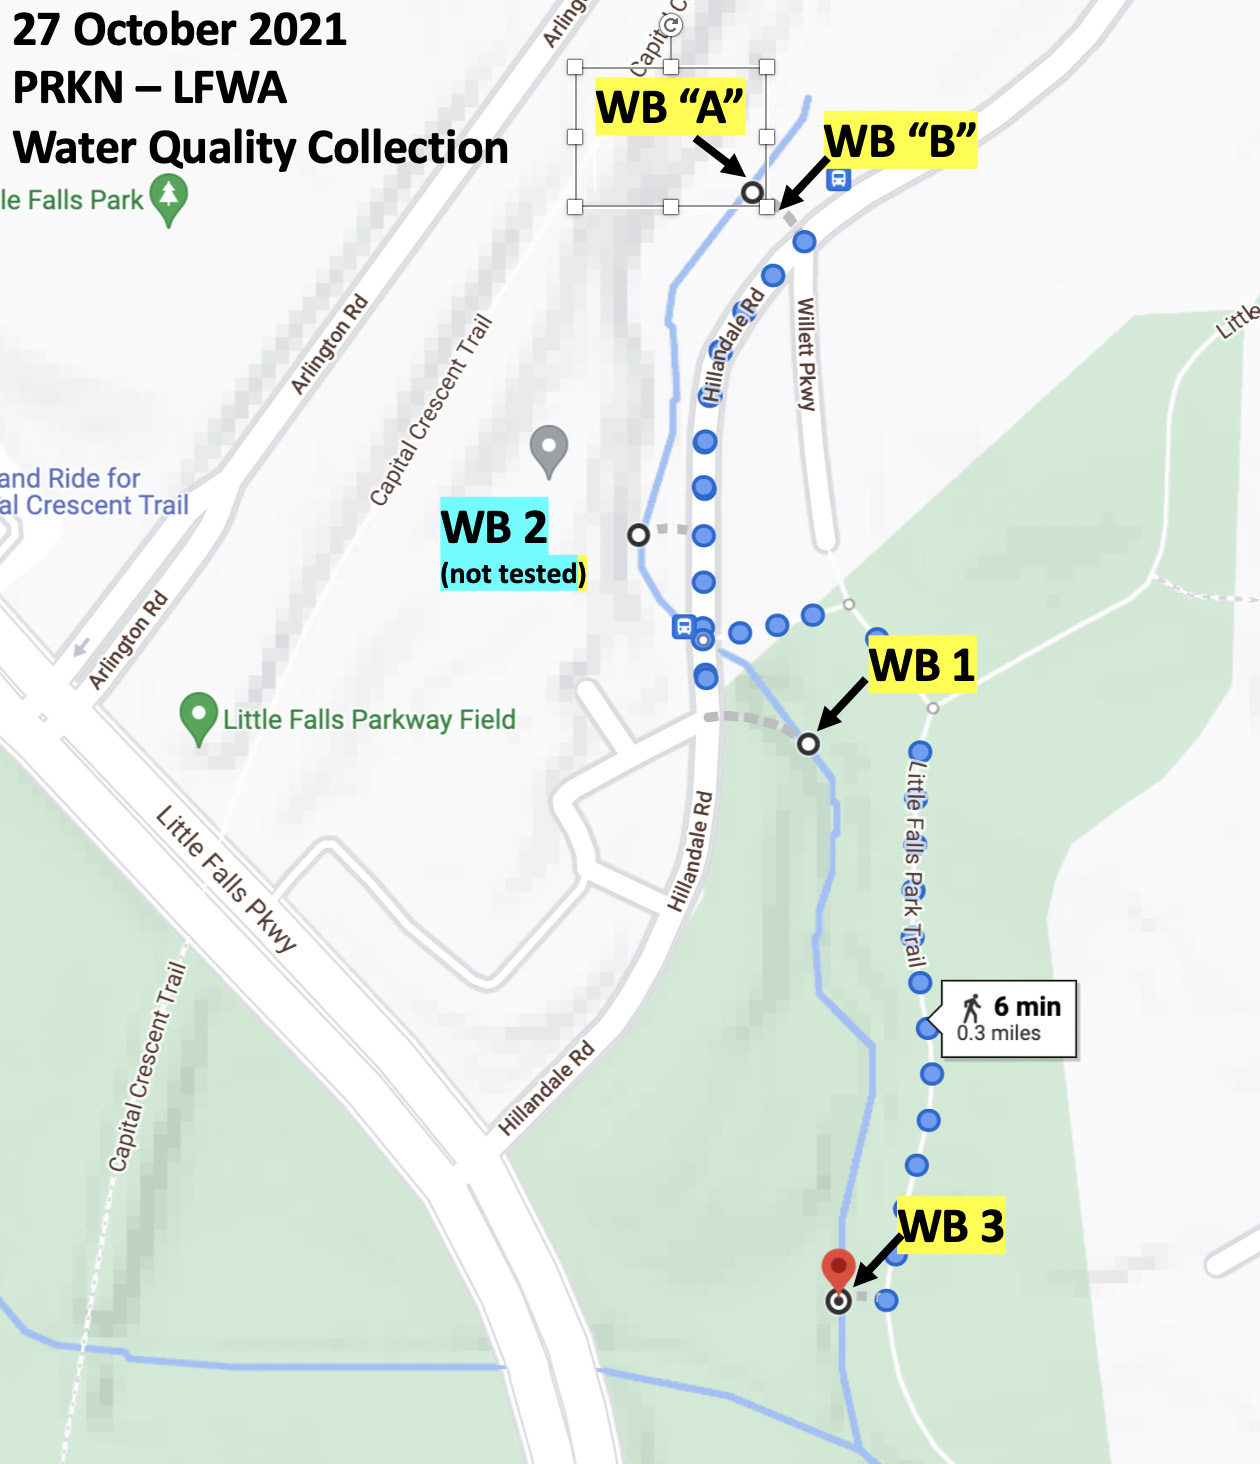
willett Branch results 2021-22 fall/winter/spring
Bacteria levels in the Willett Branch during the summer of 2021 consistently exceeded 2420 MPN/100 ml. So, in October of 2021 and February and April of 2022, we tested the Willett Branch periodically to see how the numbers looked in the “off season”. We also tested with a 10% dilution test, so that we could see real numbers. And we added an upstream site on the Willett Branch, above Hillandale (WBA).
Click HERE For results; Click HERE for map of locations.
2021 Results
Click HERE for a report of our 2021 findings
LFWA monitored sites along with Little Falls and Willett Branches from July to September.
2020 Results
In September 2020, LFWA volunteers collected water samples at 5 locations to test for E. coli concentrations. E Coli concentrations were HIGH at some of the locations.
Click for the September 2020 report
2009-2012 Results
By Court decree, WSSC monitored the watershed between 2009 and 2012. They did a DNA testing and found high levels of human fecal matter as well as fecal matter from dogs, deer, birds and other wildlife.